DHS Enrollment & Demographics
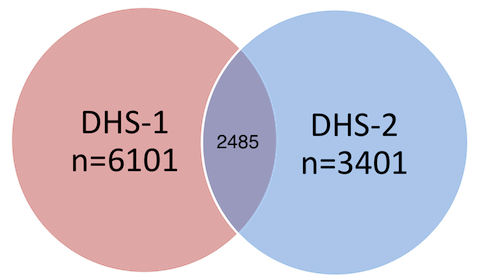
DHS-1 (n=3557)
Total number of unrelated individuals in DHS-1 who had their blood drawn (completed Visit 2)
| Ethnic Group | Men | Women | Total | Percentages |
|---|---|---|---|---|
| African American | 774 | 1,060 | 1,834 | 52% |
| White | 501 | 546 | 1,047 | 29% |
| Hispanic | 252 | 350 | 602 | 17% |
| Other | 44 | 30 | 74 | 2% |
DHS-2 (n=3401)
Total number of individuals who completed the clinic visit in DHS-2
| Ethnic Group | Men | Women | Total | Percentages |
|---|---|---|---|---|
| African American | 630 | 1,096 | 1,726 | 51% |
| White | 499 | 590 | 1,089 | 32% |
| Hispanic | 197 | 282 | 479 | 14% |
| Other | 60 | 47 | 107 | 3% |
DHS-1 & DHS-2 (n=2485)
Total number of unrelated individuals who completed DHS-1 and DHS-2
| Ethnic Group | Men | Women | Total | Percentages |
|---|---|---|---|---|
| African American | 495 | 789 | 1,284 | 52% |
| White | 381 | 424 | 805 | 32% |
| Hispanic | 145 | 203 | 348 | 14% |
| Other | 31 | 17 | 48 | 2% |
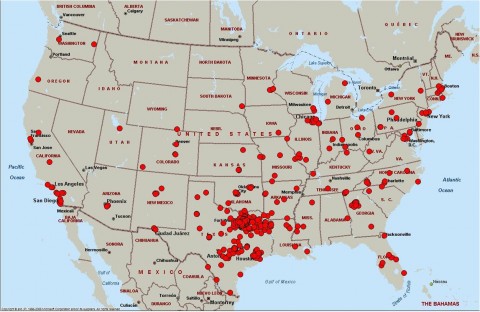
Current Map of DHS Cohort